Updated February, 2024.
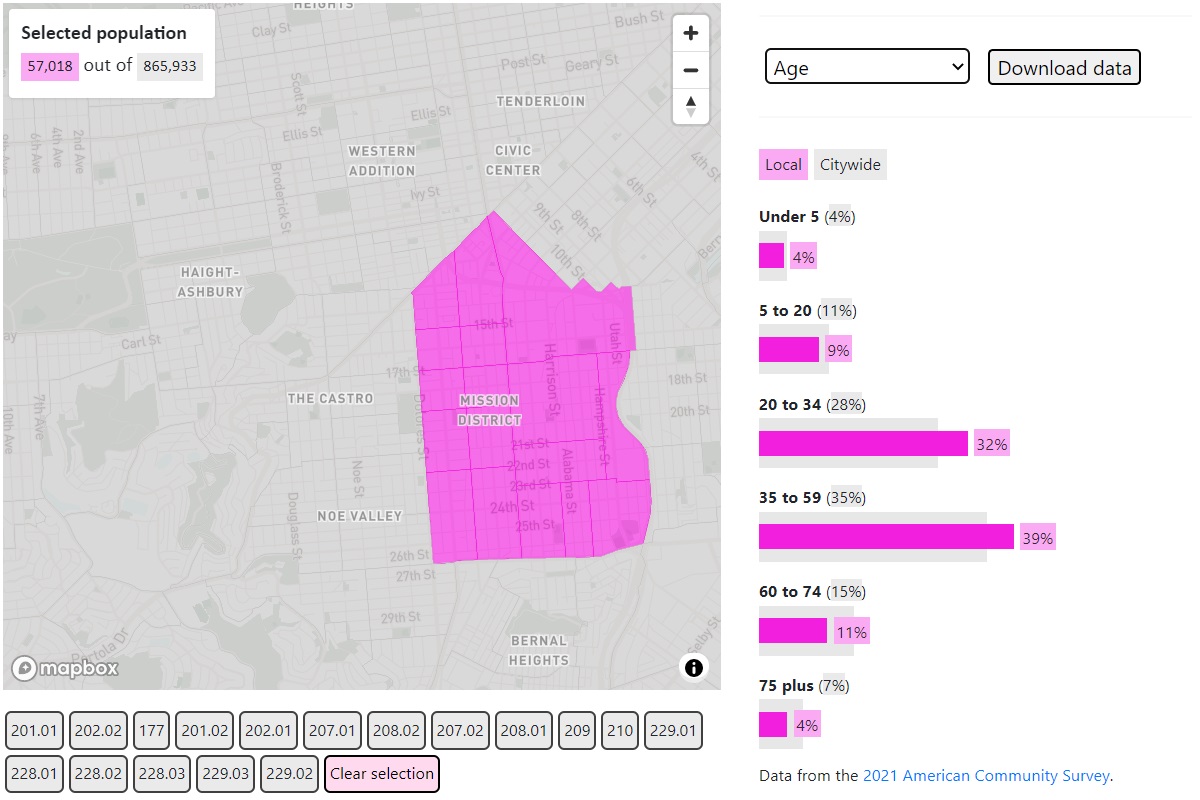
Our snazzy tool allows you to build a custom area and look at it through a variety of lenses, seeing how it compares to the city at large.
Simply select some census tracts on the map below to get started. You can use the dropdown menu to select a dataset, and hit the download button to peruse the raw data yourself.
So far, we have spotted poor internet access in Western Addition, shockingly high larceny rates on Embarcadero — driven by car break-ins — and strong correlations between income and race throughout the city. In the comments, let us know what you find.
Note on the data
Most of the datasets displayed in this tool are from the 2022 American Community Survey. The ACS is a yearly survey conducted by the Census Bureau. Each figure reported in the survey contains a margin of error. To see the error margins for each dataset, click the links in the tool footnotes.
The “crime” dataset works a little differently. It is derived from 2023 San Francisco incident report data. We removed supplemental incidents to eliminate double counting, and discounted incidents without any geographic information. We included five of the city’s most common crimes.
It is important to note that the incident report dataset is not the official source of crime statistics, but rather a log of police incidents. We used this dataset because it includes precise geographic data, unlike the finalized figures.
We are hoping to update this tool periodically by adding new datasets. If you have an idea for a dataset you would like to see mapped, or if you spot any bugs, please let us know at will@missionlocal.com.
You can access the code behind the tool on GitHub.


Is it possible to add DV as it’s own crime category to compare rates?
Also wondering if Pacific Islander is basketed under “Asian” or “Other”?
Thanks for your questions. Pacific Islanders are included in “Other,” as are Native Americans and instances where people put two or more races down in the survey. Here is the original source if you wanted to pull out Pacific Islanders specifically: https://data.census.gov/table?q=B03002&g=0500000US06075$1400000&tid=ACSDT5Y2021.B03002&tp=true.
Unfortunately it doesn’t look like DV is pulled out as its own category in the crime dataset. I suspect they are simply recorded in the assault numbers. Just in case it is helpful, the source is here: https://data.sfgov.org/Public-Safety/Police-Department-Incident-Reports-2018-to-Present/wg3w-h783.
this is a really fun tool.
Super cool, thank you Mission Local
My bad… those are definitely census tracts and not census block groups!
FYI, those are Census Block Groups. Census Tracts encapsulate more area.
Neat tool!
Very cool!
Interface doesn’t work on iPad os 16.3.1
It shows the map but not the data widgets when a topic is selected
Oh that’s frustrating – I will investigate.
Update: This should now be fixed, but if anyone is still facing issues then please let me know. Thanks!