After months of political wrangling and intense number-crunching, the final budget for San Francisco’s coming two years was released by the Controller’s Office yesterday.
And it is a whopper. The $14.6 billion figure for 2023-24 is the largest budget the city has ever seen, at a time when revenues are in a post-Covid-19 dip. The next fiscal year, the budget will be a hair lower, at $14.5 billion.
But how is the money being raised and allocated? We have broken down all the city’s spending, supervisorial addbacks, and revenue streams so you can explore for yourself.
City budget | $29.2B for 2023-25
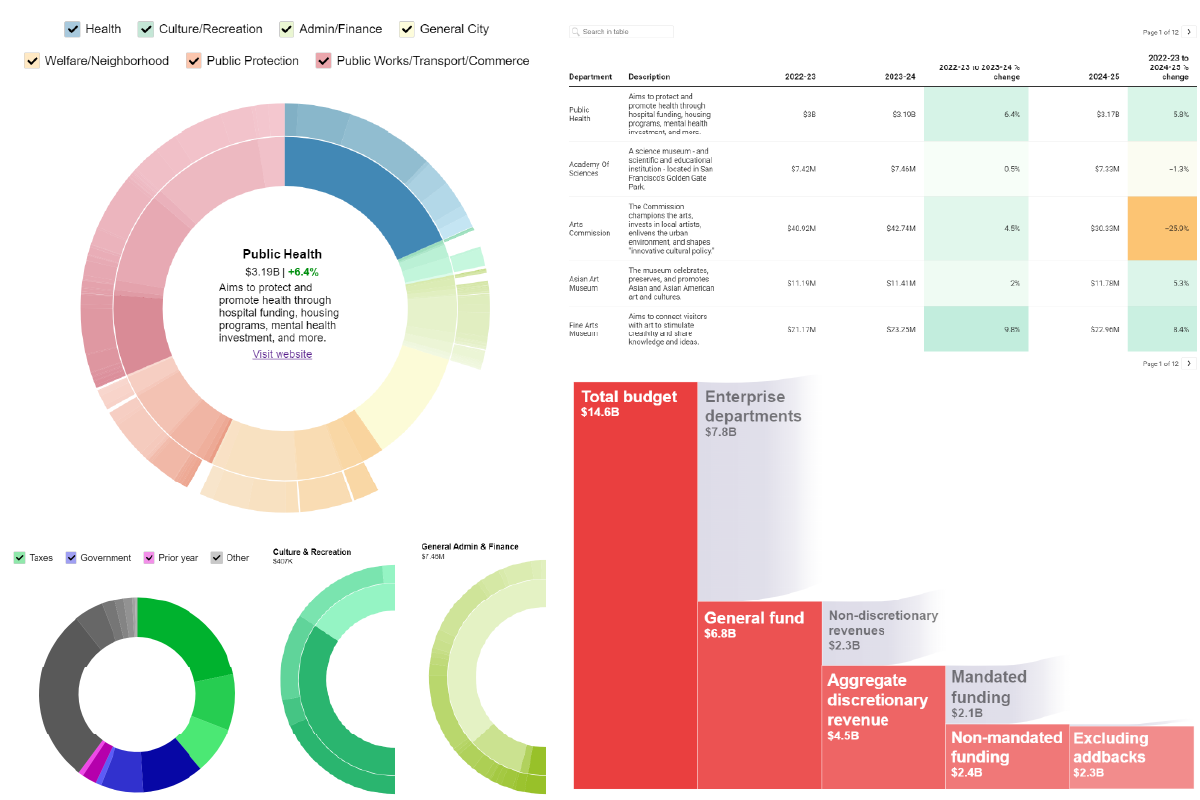
The graphic below shows the total San Francisco budget for the next two years.
Click the inner ring to peruse departments, and the outer ring to see divisions within those departments. The percentages indicate how funding has gone up or down since 2022-23.
For instance, funding for the Public Health department — the blue section in the inner ring — is up 6.4 percent next year. But that funding is not divided evenly: The Population Health Division of the department, which focuses on disease prevention, among other issues, is seeing an 18.2 percent cut.
The Police Department budget is growing by 8.5 percent — one of the largest departmental increases — while the Sheriff’s Office budget is shrinking by 2.7 percent. The Department of Early Childhood Education, launched just last year, is shrinking 7.9 percent, as is the Department of Building Inspection, by 7.3 percent.
Let us know what other patterns you find.
Discretionary spending
The mayor has the greatest responsibility for creating the budget. But even her power has limits.
Let's see how much of the budget can be set by the mayor, and how much is "locked in" through enterprise department fees, state and federal grants, and other inflexible costs.


The total city budget for 2023-24 comes to a record-breaking, eye-watering high of $14.6 billion. That's enough money to fill roughly 1,380 Olympic swimming pools with Anchor Steam.
Mayor London Breed has the greatest responsibility for setting this budget — but a lot of spending is still out of her hands.
Roughly 53 percent of the budget — some $7.8 billion — is allocated to so-called "enterprise departments." These are city departments that largely raise and spend their own funding, meaning they are mostly outside the mayor's control.
Examples include the Municipal Transportation Agency and the airport.
That leaves $6.8 billion in the "General Fund," which pays for the remaining departments. But there are still limitations on how this fund can be spent.
Roughly $2.3 billion goes toward what are called "non-discretionary revenues." These include federal and state funds that need to be spent on certain things — such as the public assistance program CalWORKs and CalFresh food stamps.
That leaves the mayor with $4.5 billion "aggregate discretionary revenue" to play with. This money is largely raised via taxes. But even this money cannot be spent however she likes.
Some $2.1 billion of the discretionary revenue has been allocated to various city departments through voter mandates.
For instance: The library is required to receive around $182 million, the Municipal Transportation Agency must receive $581 million, Children's Services has to receive $620 million, and so on. The mayor can — and often does — choose to top up these mandated payments.
That leaves around $2.4 billion in the pot — or about 227 Olympic swimming pools of Anchor Steam.
That is still a huge amount of money, although it should be noted that lots of the spending here is "baked in" to expenses that are very hard to lower, such as salaries.
Finally, the Board of Supervisors has some ability to shuffle around funds after the mayor has proposed her budget.
This year they have reallocated some $42 million for 2023-24 and $33 million for 2024-25, mainly restoring or expanding social programs for underserved communities.
Addbacks | $75M for 2023-25
After the Mayor's Office works out a preliminary budget, the Board of Supervisors has the opportunity to advocate for tweaks to restore cut funds or expand certain programs. These are called "addbacks."
This year, the board reallocated roughly $75 million over the next two years. This is a fraction of a percent of the overall budget — around 0.2 percent, in fact — but this reallocation is still more than we would see in a typical year.
And, although addbacks make up a small part of the overall budget, they can have an outsize impact. Many of the budget reallocations go to funding programs for marginalized groups.
The Mission has done well this year, with addbacks of $550,000 for street cleaning, $300,000 for a daytime sleeping program for homeless residents, $150,000 in arts grants, and more.
Use the graphic below to explore all of the addbacks in this budget cycle. The inner ring indicates the impacted department and the outer ring describes the program. Click to see details.
Revenue raised | $29.2B for 2023-25
The city plans to raise money for its budget from a variety of sources. Some 29 percent will come from charges for services -- such as parking fees, permit costs, and museum tickets -- and 39 percent will come from taxes.
Take a look at the graphic below to see where the rest will come from. Bear in mind that revenues are projections and could change depending on many factors, not least the performance of the economy.
Methodology
Data for city funding, discretionary spending, and revenue collection was provided by the San Francisco Controller's Office. Data on supervisorial addbacks was provided by the office of Budget Chair Connie Chan.
Click on these links to download raw data for the budget, for addbacks and for revenue.
If you spot any errors in the data, please let us know at will@missionlocal.com.
City budget | Discretionary spending | Addbacks | Revenue
Excellent work!
Thank you, Will and Mission Local! Great work!
I am completely impressed. You have taken an almost incomprehensible set of information and made it meaningful.
Absolutely fantastic.
Would be great to see on the table the net amounts that are going to/coming from “enterprise departments” (ie SFO is listed as $1.49B – but of that is it all money they raised, or is any of it (ie for salaries/retirements/benefits/police/fire/etc) coming out of the General Fund?
This is phenomenal and so incredibly helpful. Thank you so much, Will!
Thank you so much! This is a fantastic breakdown and guide to the city budget. Biggest takeaways I noticed:
Largest percentage increase in Department budget – 42.3% – Human Rights Commission
Largest percentage decrease in Department budget – 22.5% – Port Commission
5 Departments with largest percentage increase in budget:
Human Rights Commission – 42.3%
Retirement Systems – 19.4%
Airport – 12.8%
Fine Arts Museums – 9.8%
Recreation and Parks – 9%
Is there a budget breakdown showing the amounts for pensions – both to vested retirees drawing pensions and for current employees in the retirement system. How about the amounts for current and future health benefits for current and former city employees? How about current City payroll, breaking out workers on leave?